

The Wavy Track in an M1 Subframe
22 October 2026 · John
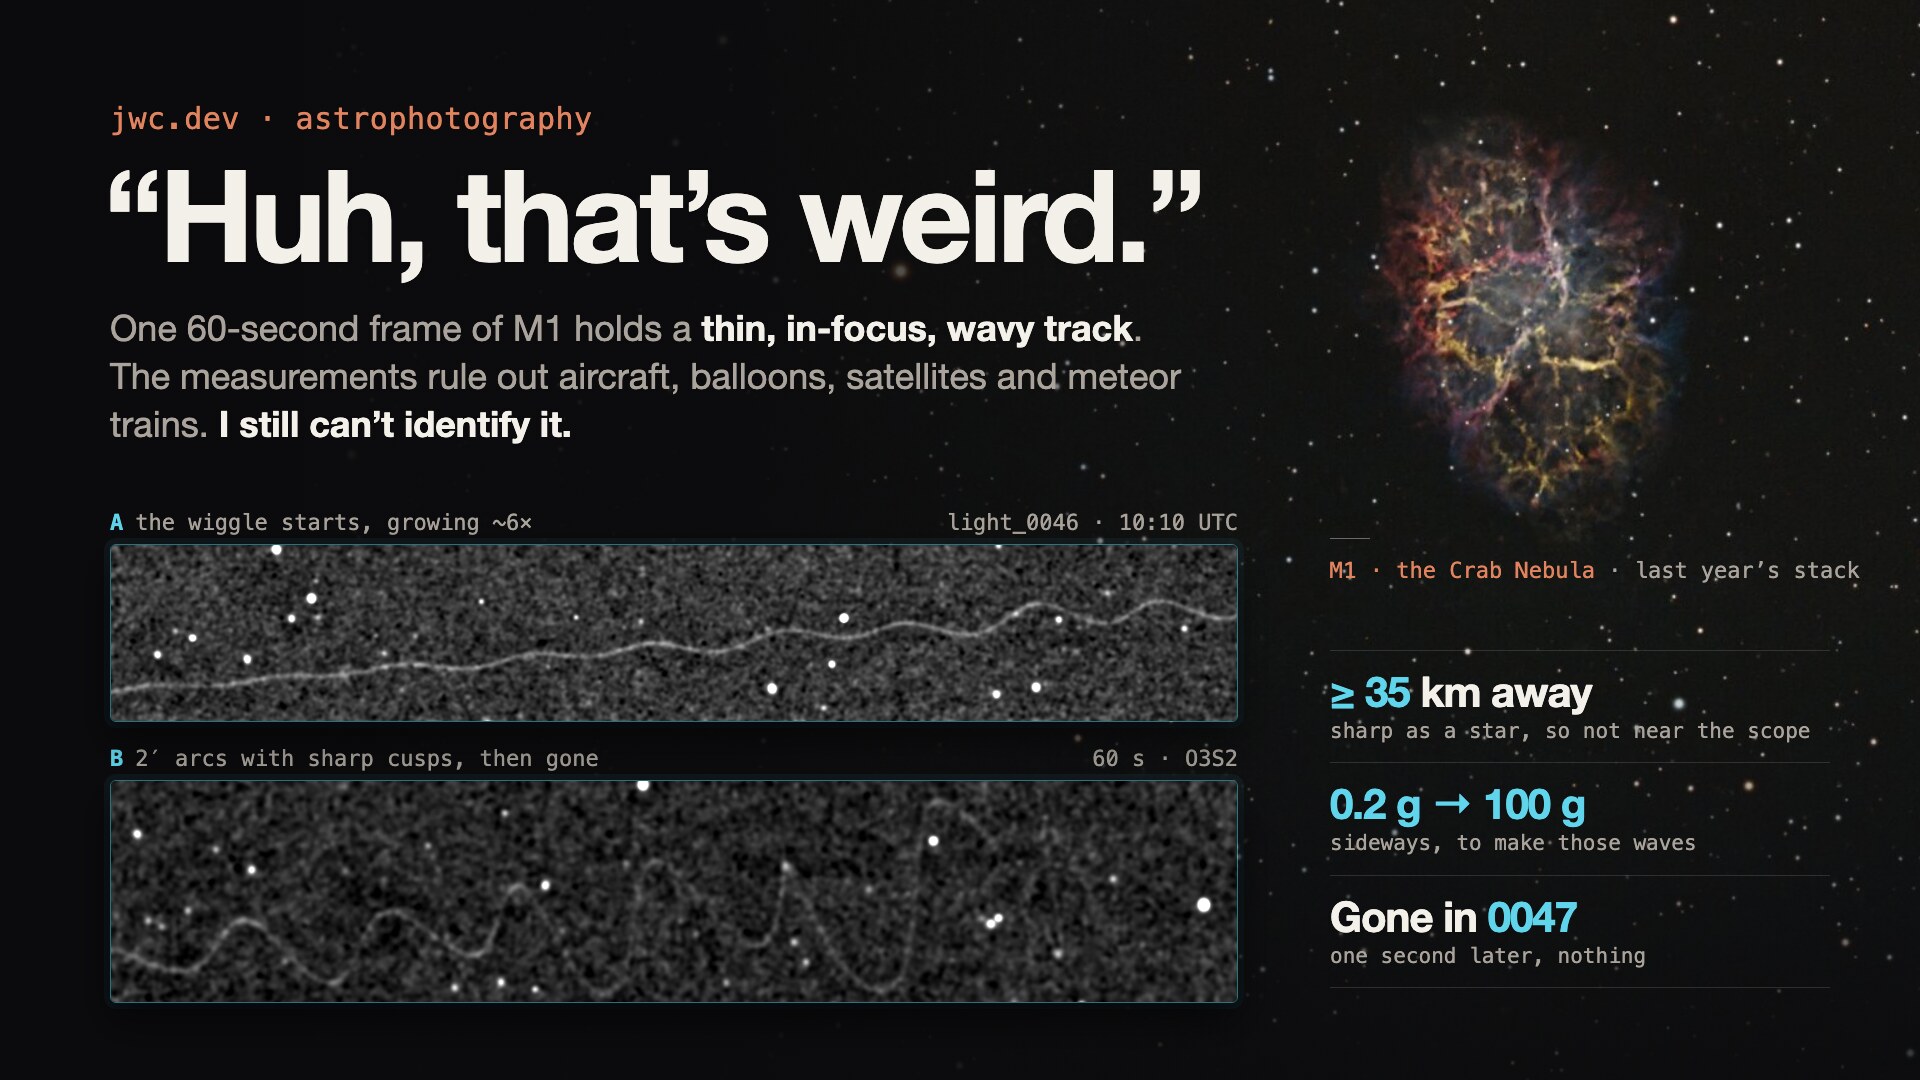
One 60-second frame of M1 (light_0046, 13 October 2026, 05:10 CDT, Huntsville) holds a thin, in-focus wavy track next to an ordinary straight streak. It is not something near the scope, an aircraft or a cosmic ray. The best explanation so far, prompted by an AstroBin reply, is a fast satellite or meteor recorded while the telescope rang after a brief knock. That is not yet confirmed.
Background
I'm shooting M1, the Crab Nebula, again this year. Last year's image is here.
Each finished image is made from a large number of 60-second subframes that are stacked. Not every subframe is usable. Tracking errors, focus drift, airplanes and clouds all spoil frames, so before stacking I look at every one and delete the bad ones.
Satellites and meteors are rarely a problem. Their streaks are usually faint enough to disappear into the background noise once the frames are stacked.
This time I came across a frame and thought, "huh, that's weird." So, like anyone working out how to use the new AI tools, I asked Claude to look at it. The measurements and reasoning in the rest of this article are Claude's analysis of my original FITS files, and it is written up here as it happened: starting from a guess, being corrected by the data, and ending without a definite answer.
The frame
Light_0046 is a 60-second exposure of M1 through an O3S2 dual-band filter, taken with a Celestron EdgeHD 8 (203 mm aperture, about 2,000 mm focal length) and an ASI2600MC Pro on an AM5 mount. The FITS header gives DATE-OBS 2026-10-13 10:10:06 UTC, which is 05:10 CDT, so the filename carries local time. The site is Huntsville, Alabama (34.70° N, 86.58° W per the header).
At that time M1 stood roughly 77° above the horizon, near the meridian, and the Sun was about 22° below it. Both figures are my own approximate calculations, not header values. The plate scale is 0.39 arcsec per pixel and the field is about 0.67° × 0.45°.
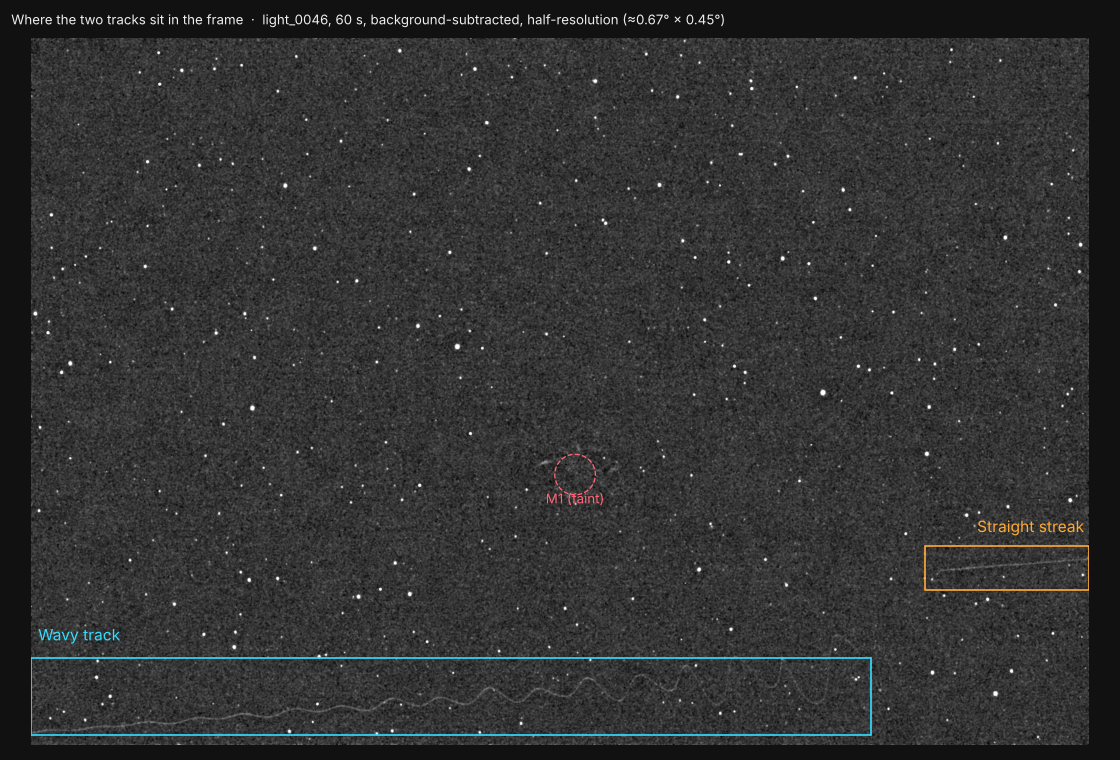
The wavy track runs along the bottom of the frame as you see it in a PNG preview (row 0 at the top). The straight streak is at lower right. Left to right is roughly north on the sky.
The two tracks
Both tracks run north–south on the sky, within about 2° of each other. The straight streak is a plain, uniform line. The wavy track is the odd one.
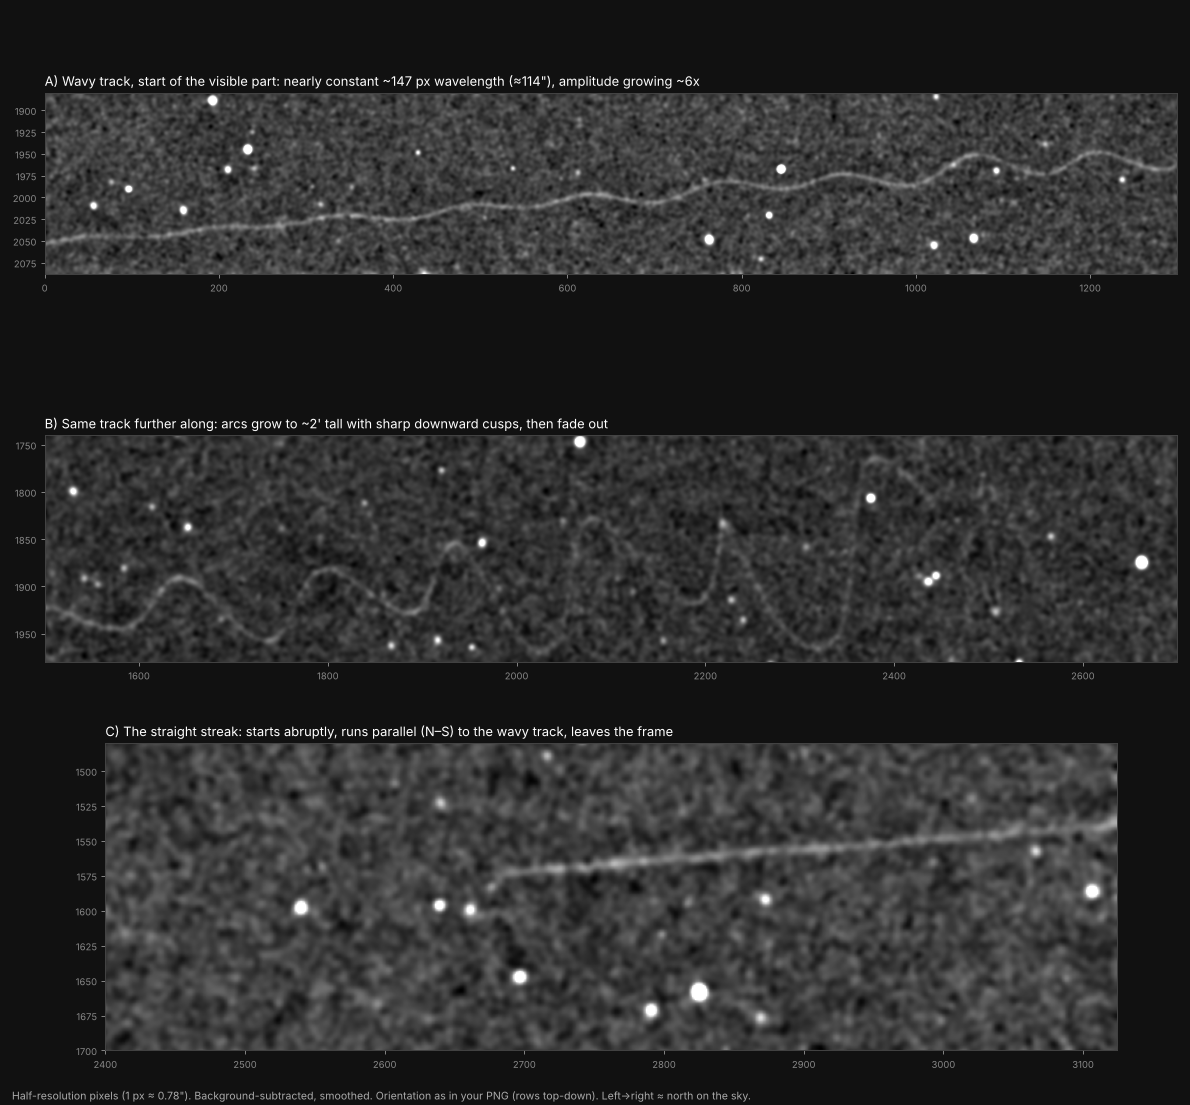
- Panel A: the track enters at the left frame edge as a gentle wave of nearly constant wavelength, with amplitude growing steadily.
- Panel B: further along, the waves become tall arcs about 2′ high with sharp downward cusps, then fade out inside the frame.
- Panel C: the straight streak starts abruptly mid-frame, runs parallel to the wavy track about 2′ to one side of where it fades, and leaves the frame.
The knot at the end
The right-hand end of the track, where the swings are largest, is faint enough to sit at the noise limit. After a PixInsight adaptive stretch I could see more structure there than the automatic trace picked up, so I drew over what I saw, and Claude tested each stroke against the calibrated data.

Each stroke was compared with the same shape placed at 400 random spots in empty sky, using star-masked, lightly smoothed data and allowing ±2 px for hand-drawing error.
| Stroke | Chance of a match in empty sky | Result |
|---|---|---|
| Top arc, descending right (also found by the automatic trace) | 0.2% | Track |
| Small arc, top right | 1% | Track |
| Short stroke near the bottom | 1% | Track |
| Long diagonal down the right side | 3% | Track |
| Five strokes inside the big arc | 30–70% | Indistinguishable from noise |
The three supported strokes add one more swing past the end of the automatic trace: a top near x ≈ 5,010 (full resolution), then a long fall. The previous top is about 240 px to the left, close to the measured wavelength of about 294 px. With eight strokes tested, one could reach the 1% level by chance, but three lining up into one more swing is much harder to explain that way. The five strokes inside the big arc look like nothing more than empty sky; they are shown in yellow and not counted as track.
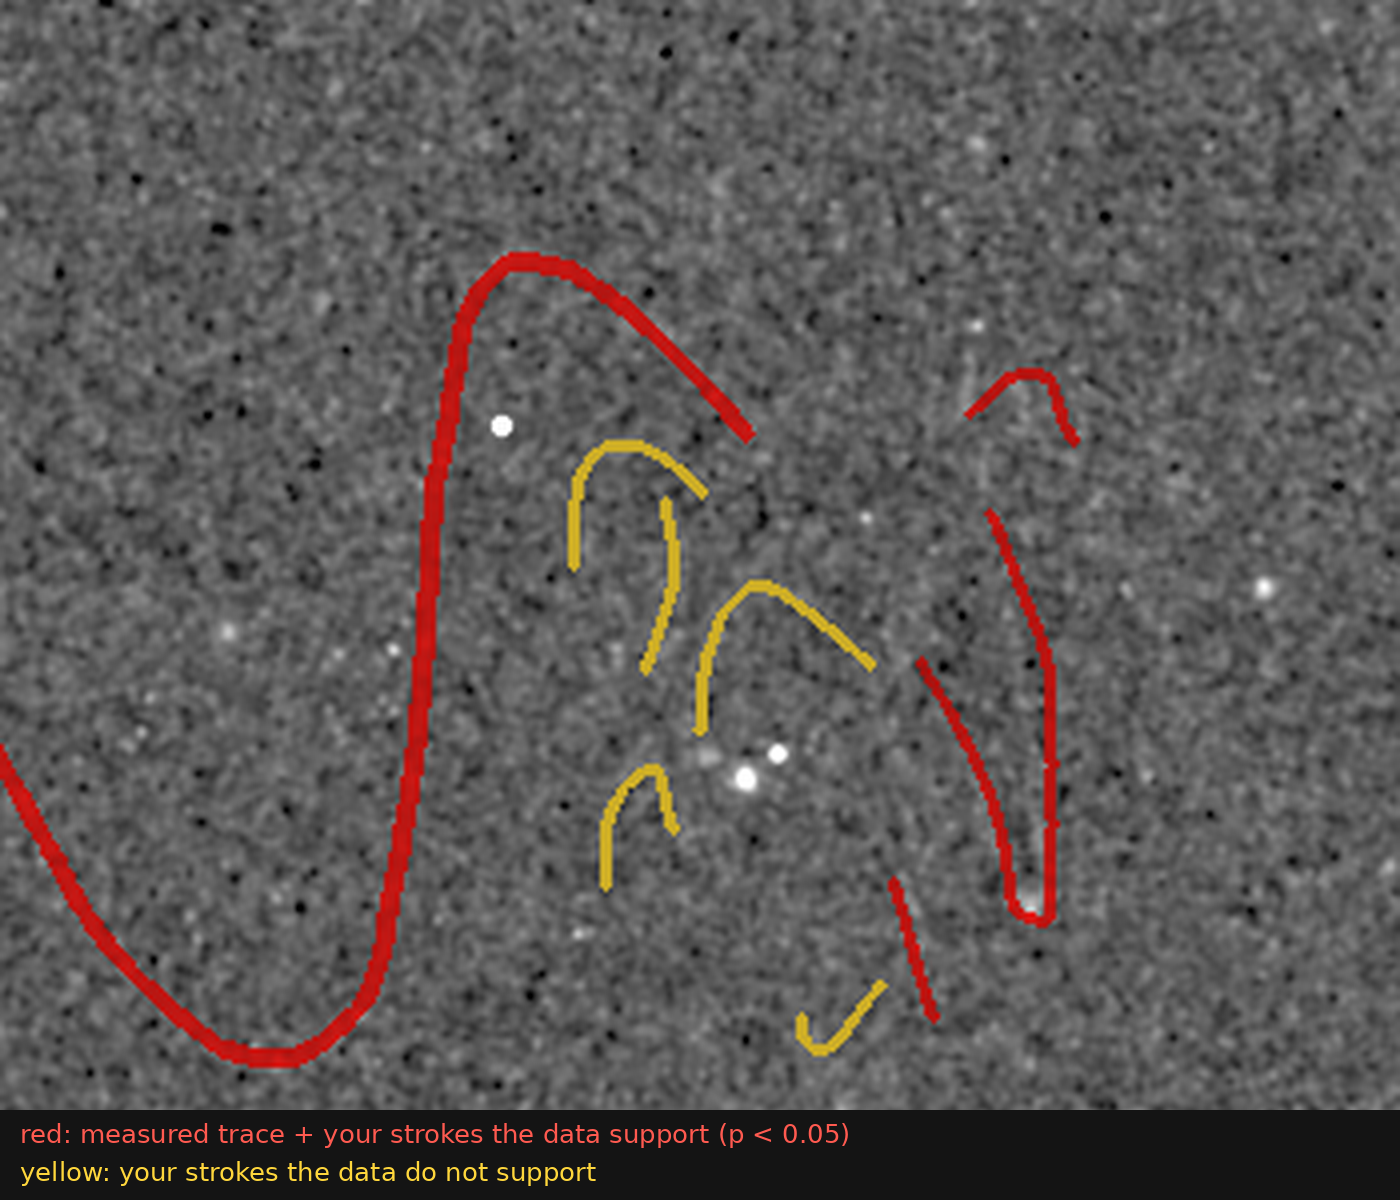
The red drawn from hand strokes is only as precise as the drawing.
What the data show
The track is a real, point-like, steadily glowing source with a smooth growing wiggle, and it is in focus, so it is far away.
| Property | Value | How it was measured |
|---|---|---|
| Exposure | 60 s, 10:10:06–10:11:06 UTC | FITS header |
| Direction | North–south along Dec, both tracks within ~2° | Plate solution (WCS) in the header |
| Wavy track length | About 31′ (0.51°), left edge to where it fades | WCS positions of the traced path |
| Minimum angular speed | At least 31″/s | Track length ÷ 60 s |
| Wavelength | About 114″ (147 half-res px), steady | Spacing of 10 clean wave peaks |
| Wave amplitude | 9″ peak-to-trough, growing to 56″ over the first 22′, then arcs about 2′ tall | Traced path, detrended |
| Cycles | Roughly 14, plus one fainter swing in the knot | 10 clean waves plus the large arcs |
| Width | 2.2″ FWHM (5.8 px) against 1.9″ (4.9 px) for the stars | Profile fits across the track and across 245 stars |
| Implied distance | Roughly 35 km or more | Defocus: blur ≈ 203 mm × 2,003 mm ÷ distance |
| Brightness along track | Steady to about ±15% over most of its length, dimmer at the far end | Mean excess per column, 6 bins |
| Colour (R : G : B share) | 0.32 : 0.34 : 0.34 for the wavy track, 0.32 : 0.37 : 0.30 for the straight streak | Bayer planes, background-subtracted |
| Neighbouring frames | No track in 0045 or 0047 | Ridge-filter search of the full frames |
The colour is flat across red, green and blue, and the straight streak matches it. That points to broadband light, not a single-colour LED, though the dual-band filter limits how much that can say.
What it cannot be
If the source itself made the wiggle, every ordinary candidate fails on at least one measurement. The AstroBin section below explains why that "if" matters.
| Candidate | Verdict | Why |
|---|---|---|
| Insect, bat, bird, hair or spider silk near the scope | Ruled out | An object at distance d is smeared to about 203 mm × 2,003 mm ÷ d on the sensor: roughly 11 px at 10 km and over 1,000 px at 100 m. The track is only about 1 px wider than a star. |
| Aircraft or drone | Ruled out | An airliner at 12 km would be about 9 px wide, plus it could not wiggle sideways by an arcminute every few seconds. |
| High-altitude balloon with a swinging payload | Ruled out | Needs 0.2 g early on and 1–3 g in the big arcs at the nearest allowed distance. A payload on a few metres of line cannot swing 10–20 m. |
| Satellite | Possible, if the scope shook | Orbits are smooth, so a satellite cannot wiggle by itself. A low satellite crossing in about a second while the scope shook could make this track; see below. |
| Meteor persistent train | Unlikely | Trains at about 90 km are typically tens of metres or more across, so tens of arcseconds wide and fuzzy. This track is as sharp as a star. A train would also lie along the meteor's path, not beside it. |
| Mount, tracking or vibration | Not ruled out for a short shake | Motion lasting most of the exposure would copy the wiggle onto every star, and the stars are round. A shake lasting only a second or two would not show on the stars; see below. |
| Sensor or electronics artifact | Not excluded, but unlikely | A smooth 2-D curve that grows steadily, stays at constant brightness and has a sky-like colour does not resemble read noise, banding or amplifier glow. |
Why no real object fits
A real object at 35 km or more would need to accelerate sideways at roughly 0.2 g to over 100 g, depending on distance and speed.
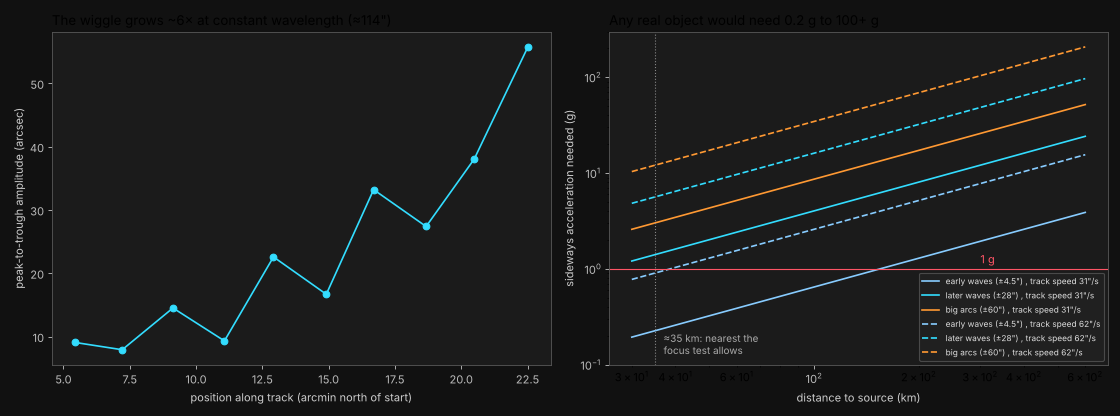
The estimate assumes the source crossed the visible 31′ in at most 60 s, so the wave period is at most about 3.7 s (114″ ÷ 31″/s). For a sideways oscillation of semi-amplitude A at angular frequency ω, the acceleration at distance d is ω² × A × d.
- Nearest allowed distance (35 km): about 0.2 g for the early waves, 1.2 g for the later waves, and 2.7 g for the big arcs.
- Farther away or faster: every case gets worse. At 100 km the big arcs need roughly 8 g; doubling the track speed quadruples all of these.
No balloon, aircraft, drone or satellite does that. Either the source is something that can move this way, or the motion is not the motion of a single physical object.
This argument assumes the source was visible for most of the 60 s. If it crossed in a second or two, as a meteor or a low satellite would, the wiggle need not be the object's motion at all. The AstroBin section below follows that up.
The neighbouring frames
Neither the frame before nor the frame after contains the track, or any other long streak.
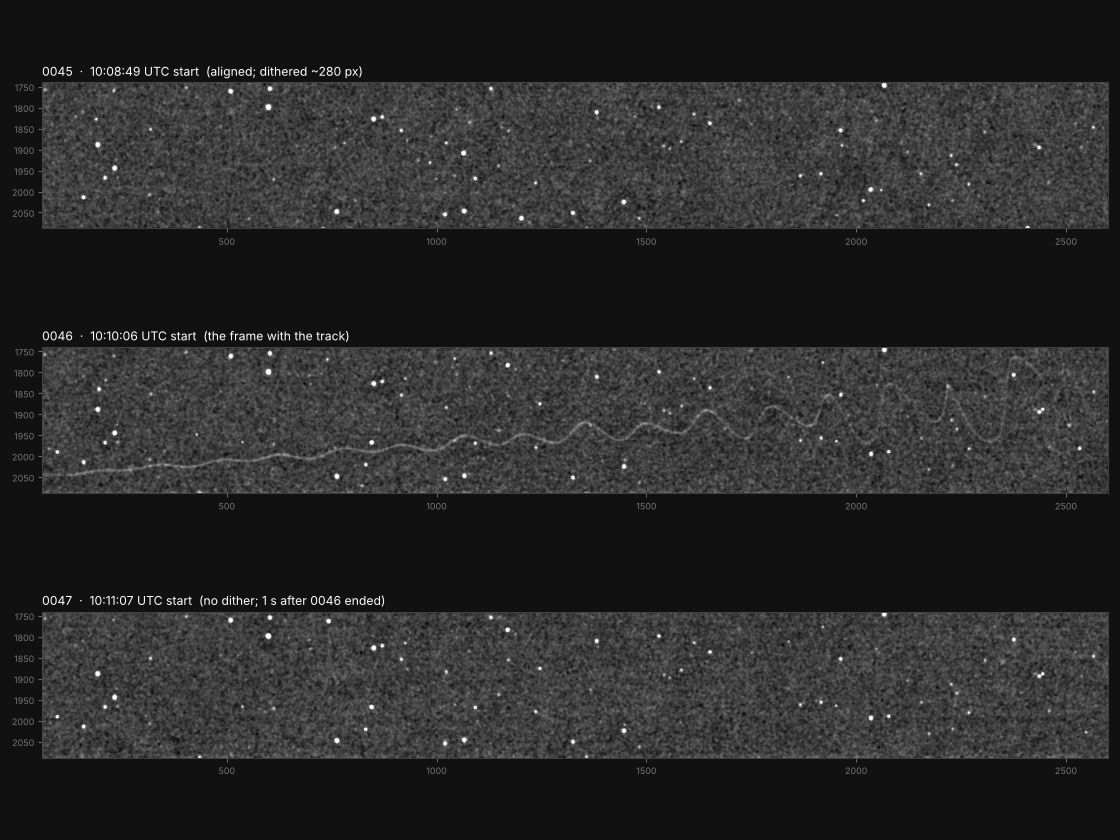
- 0045 started at 10:08:49 UTC. It was dithered about 280 half-resolution pixels (3.6′) from 0046, so I aligned it using the stars before comparing.
- 0046 is the frame with the track, 10:10:06–10:11:06 UTC.
- 0047 started at 10:11:07 UTC, one second after 0046 ended, with no dither. If the source had kept going north at 31″/s it would have been inside the frame for its first 20 seconds or so. It is not there.
The track also fades out inside the frame. Whatever made it stopped being visible during this one exposure.
The AstroBin suggestions
Two replies on the AstroBin thread suggested a cosmic ray and a meteor in a death spiral. The cosmic ray does not fit. The meteor does not fit literally either, but it exposes a gap in the analysis above and leads to the most likely explanation so far.
A cosmic ray
| Evidence | |
|---|---|
| For | A particle hit is instantaneous and appears in one frame only, as this does. It deposits charge whatever the colour of the Bayer filter over a pixel, which fits the track's flat colour. Low-energy electrons can leave curled tracks. |
| Against | Transient hits in this frame (found by subtracting frame 0047) are single pixels to at most 9 px across and typically over 100 ADU. The track is about 4,700 px long and only about 26 ADU per pixel at its brightest. To make it, a particle would have to travel about 18 mm sideways inside a silicon layer a few micrometres thick. The track is also 5.8 px wide, the same optical blur as a star, which a hit inside the sensor would not have. |
Verdict: ruled out.
A meteor in a death spiral
| Evidence | |
|---|---|
| For | A meteor is brief, appears in one frame only, and can start or end mid-frame. At around 100 km it is far enough away to be in focus. |
| Against | A meteor crosses half a degree in under about 2 s, so each wave would last a few hundredths of a second or less. Swinging a meteoroid ±14 m sideways that fast takes about 57,000 g even at a slow 1°/s, while the drag on a millimetre-sized meteoroid is roughly hundreds of g. Meteors usually brighten and fade; this track is steady to about ±15%. It also does not point back to the Orionid or Southern Taurid radiants (it is 30–85° off, using the AMS shower calendar), so it would have to be a sporadic meteor. |
Verdict: a real spiral is ruled out. A meteor is still possible as the light source.
Where the meteor idea leads: a fast streak and a shaking scope
The earlier sections assumed the source was visible for most of the 60 s; that is why round stars seemed to rule out mount motion. A meteor or a low satellite crosses this field in roughly 0.5–2 s. If the scope shook during that second or two, the streak records the shake. The stars, exposed for the full minute, collect only about 2% of their light during it and stay round.
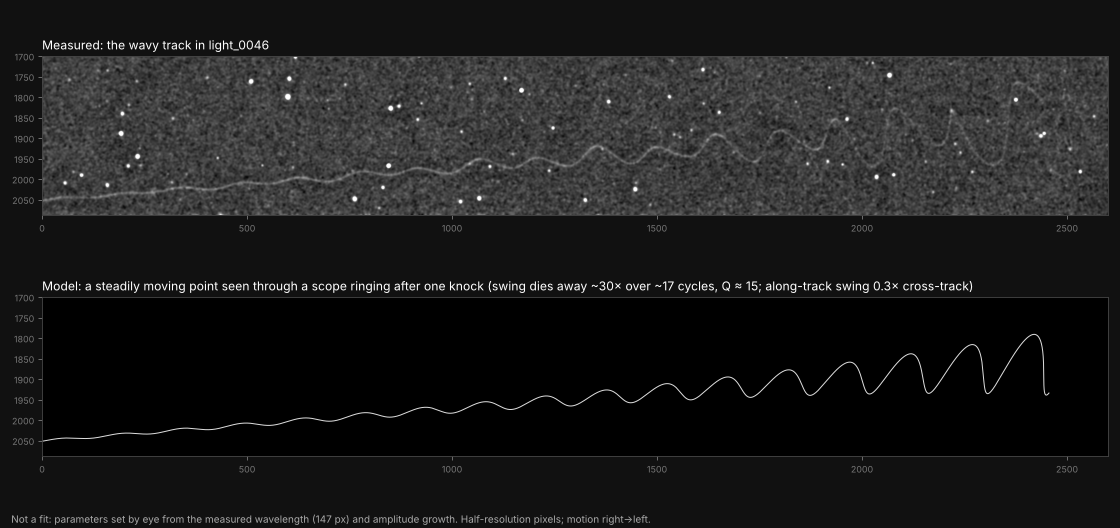
The model above is not a fit. It is a straight-moving point plus a decaying 2-D swing, with values set by eye from the measured wavelength and amplitude growth. It reproduces the steady wavelength, the exponential change in swing and the rounded arcs with sharp cusps.
For
- A knock makes a scope ring. Read right to left, the swing dies away about 30× over about 17 cycles at a steady wavelength. That is how a struck mount rings down (a quality factor Q of about 15).
- The cusps come for free. A small swing along the direction of motion, about 0.3× the sideways swing, turns the early large swings into the rounded arcs and sharp cusps in panel B.
- The fade fits. Large swings spread the light along a longer path, so the track dims where the swing is biggest.
- No impossible accelerations. The source moves in a straight line; only the telescope moves.
- It fits a one-frame event, with nothing in 0045 or 0047.
Against, or still open
- The stars cannot confirm it. The stars would swing as far as the track, but their smears would be far too faint to see. A star collects only the 0.2–2 s of light that falls during the shake, 0.3–3% of its exposure. The moving source put all its light into that window and was much brighter: from the track's brightness, about 40× the brightest star in the field at 0.3°/s, about 100× (5 magnitudes) for a low satellite at 0.7°/s, and about 400× for a meteor at 3°/s. So even the brightest star's smear would be about 1/40 to 1/400 as bright as the track, under a tenth of the background noise. Stacking the 25 brightest stars against frame 0047 duly shows nothing. That is consistent with a shake but cannot confirm it.
- It is a big swing. The largest arcs are about ±1′ on the sky, which is ±0.6 mm of image motion at the sensor. The ringing frequency depends on how fast the source moved: about 15–30 Hz for a low satellite, 30 Hz or more for a meteor.
- No known trigger. Nobody was near the scope at the time, and the tripod stands on Celestron vibration suppression pads, so a person or ground vibration is unlikely. The pads damp vibration coming up from the ground, but not a source on the rig itself: a wind gust, a cable tug, the camera's cooling fan, or the focuser or primary mirror shifting in the tube. A large swing (±0.6 mm at the sensor) with no obvious trigger is the weakest point of this explanation. A similar squiggle in a focus-mask image on AstroBin was put down to vibration, possibly from a failing camera fan (thread).
- The straight streak points to satellites. It runs within about 1.4° of parallel to the wavy track, and both run north–south. Two random sporadic meteors would line up that well under 2% of the time. Two satellites in polar orbits, both heading north–south, would be ordinary. At 05:10 CDT, satellites overhead above roughly 500 km were still sunlit (my approximation), and a satellite entering or leaving Earth's shadow can start or stop mid-frame.
If this is right, the wiggle is a recording of the telescope's vibration and the light source is ordinary: most likely a satellite, possibly a meteor.
What is left, and how to test it
The leading idea is now a fast satellite or meteor recorded during a brief shake of the scope. The two earlier ideas, a reflection of a bright source outside the field or a real steered light far away, remain possible but less likely. None can be confirmed from this frame alone.
Checks you can run
- Satellite check. Use the field centre (RA 83.64°, Dec +22.17°) and the window 10:10:06–10:11:06 UTC on 13 Oct 2026. This matters most now. A low satellite in a polar orbit would cross the field north–south in about a second, and its speed would fix how fast the scope was ringing (speed ÷ 114″ per cycle). Historical element sets need a Space-Track account; Stellarium or a Skyfield script can then propagate them. This was not done because the analysis workspace could not reach satellite catalogues.
- ADS-B history. Search the window above within about 250 km of Huntsville. This is a cross-check only: the focus test already excludes aircraft, so a clean result confirms the conclusion and a hit would be surprising. Options are listed below.
- Meteor reports. Check the American Meteor Society and NASA all-sky camera reports for 13 Oct around 10:10 UTC. A bright meteor could explain the straight streak.
- Your own logs. Look at the ASIAIR guide log and the capture log for 10:10–10:11 UTC for any disturbance, and think back to wind, a cable or anything touching the rig. A tap test on a bright star in a short exposure would show how the scope rings: a steady frequency dying away over a dozen or so cycles would support the shake explanation. The sensor temperature stayed at −15 °C across all three frames.
- Other imagers. Post the original FITS crop with the time and position (RA/Dec above) on AstroBin or Cloudy Nights. An imager within a few hundred kilometres shooting the same area would settle whether it was a real distant source.
Getting ADS-B history
ADS-B data could not be pulled from the analysis workspace, so this has to be done separately. These are the routes that could be confirmed or reasonably described:
| Source | What it gives | Notes |
|---|---|---|
| ADS-B Exchange data products | Global snapshots every 5 s since May 2020, plus per-aircraft traces | Free only for the 1st of each month; everything else is a commercial agreement. Check whether the live globe's replay mode covers 13 Oct. |
| adsb.lol history | Daily readsb trace dumps (gzip JSON), open-licensed | The 2024 archive is on GitHub. Check adsb.lol's site for a 2026 archive or its replay map. |
| OpenSky Network | Historical state vectors | Needs a registered account. |
| FlightAware, Flightradar24 | Historical tracks | Free history windows are short; a 9-day-old query may need a paid tier. |
In any of these, filter to 2026-10-13, 10:10–10:12 UTC, within about 250 km of 34.70° N, 86.58° W. Then look for tracks that pass within a few degrees of overhead (M1 was near 77° elevation).
Method and caveats
The raw FITS was read, each 2×2 Bayer cell was binned to one half-resolution pixel, a median-filtered background was subtracted, and the result was smoothed lightly for display. The track was traced with a ridge filter and a minimum-cost path; that trace is reliable out to about x = 1,850 half-resolution pixels, and the amplitude and wavelength figures come from that stretch. The height of the large arcs beyond it is read from the images. Sky positions come from the plate solution stored in the FITS header.
- Distance limit. It assumes the scope was focused at infinity and the source is point-like. The roughly 3 px of extra width gives about 35 km; treat it as 30–40 km, not a precise bound.
- Speed and acceleration. Both assume the source crossed the visible track within the 60 s. If it was visible for less time, the speed is higher and the acceleration far higher.
- Sun and elevation. The 22° and 77° figures are approximations.
- Not checked. Satellite catalogues and ADS-B data were not accessible.
- Earlier guesses retracted. Early in the conversation Claude suggested an insect, a bat or bird, and a swinging balloon payload. The focus test rules out the first two, and the acceleration estimate rules out the third. That acceleration argument itself assumed the source was visible for most of the exposure; the AstroBin meteor suggestion showed the assumption was too strong.
Sources
- Frames light_0045, light_0046 and light_0047 (FITS headers and pixel data), supplied by the imager.
- ADS-B Exchange: sample and historical data products
- adsb.lol globe history 2024 (GitHub)
- AstroBin forum: "What kind of trail is this?" — a different case, a faint streak in an OIII frame that commenters identified as a spinning satellite.
- AstroBin forum: "Mysterious wavy line artifact found in M1 subframe stack": source of the cosmic-ray and meteor suggestions. The page could not be loaded for this analysis, so the suggestions are as relayed by the author.
- American Meteor Society: meteor shower calendar 2026–2027: Orionid and Southern Taurid radiants.
- AstroBin forum: "Squiggles": squiggled focus-mask spikes attributed to vibration.